<< Intro – 5 - - Introduction – 6:6 - - AI Answers >>
_ 1:3_
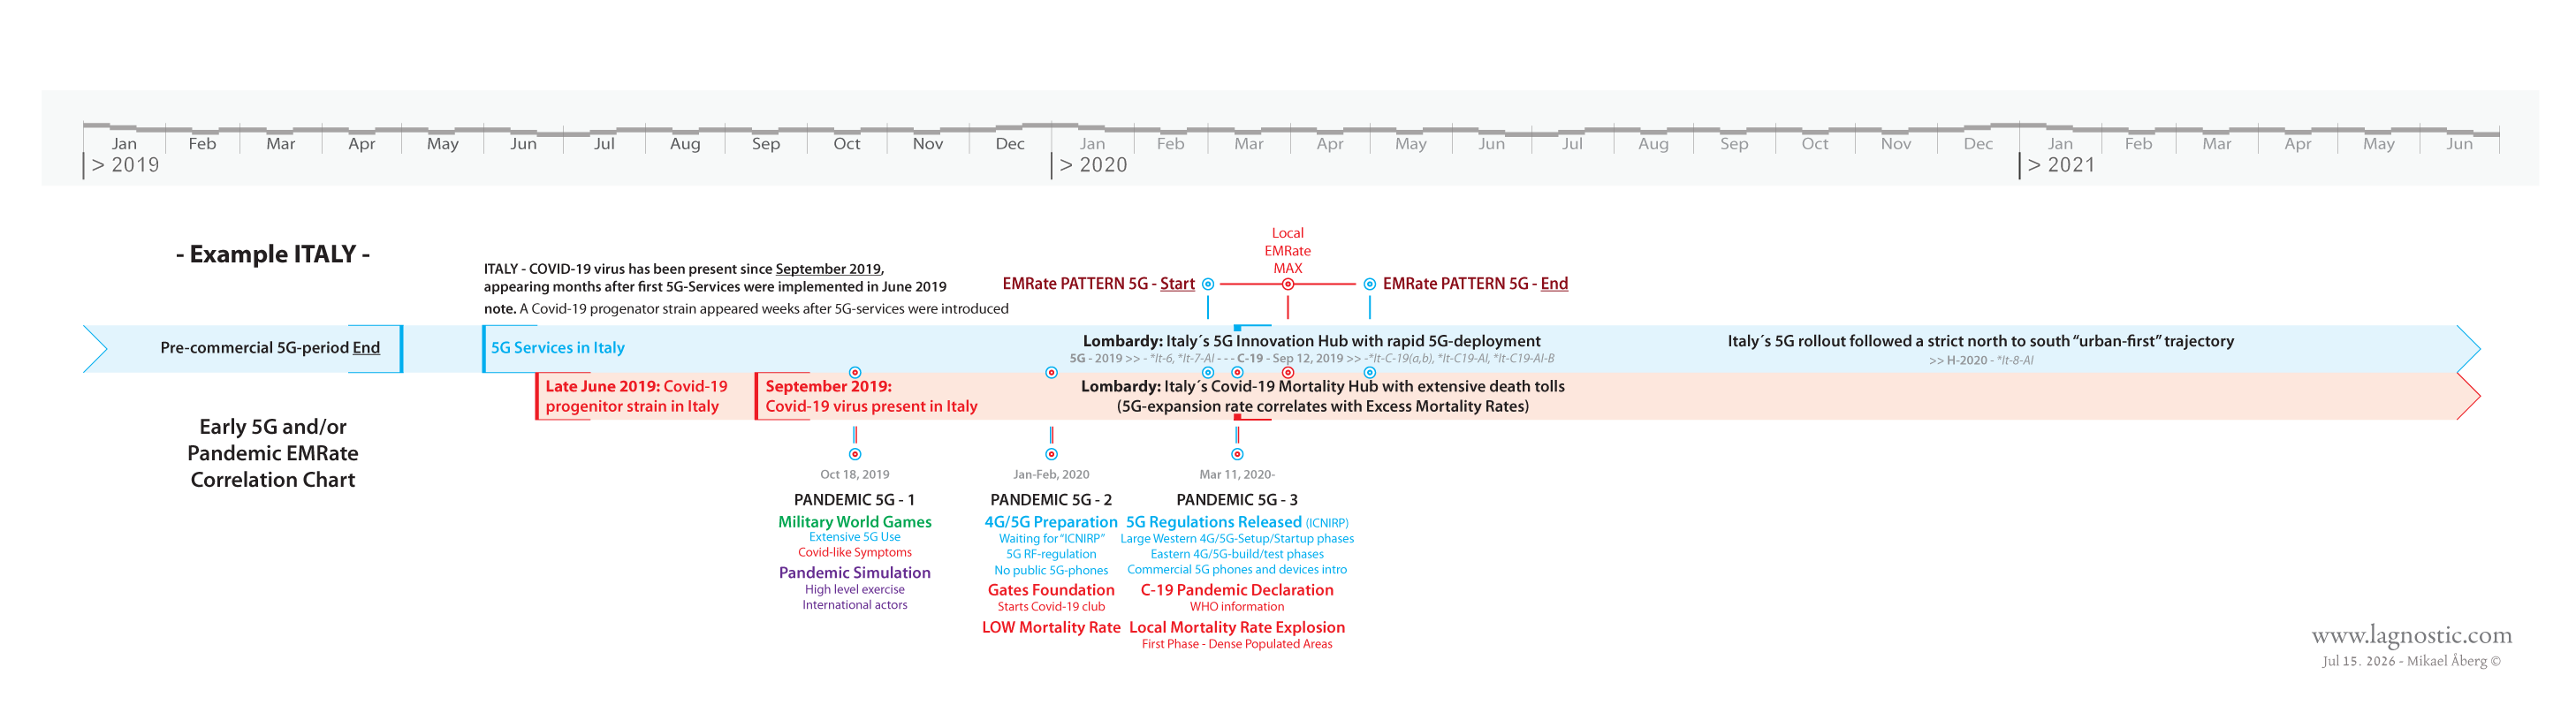
Example “ITALY” – C-19/5G/Mortality – Correlation Patterns
Descriptive block diagram showing related events and patterns associated with Italy's 5G rollout.
Full size: Click on image – (New Window, applies to all images on the page)
_ 2:3_
Early 5G Expansion, the COVID-19 Pandemic vs. EMRate
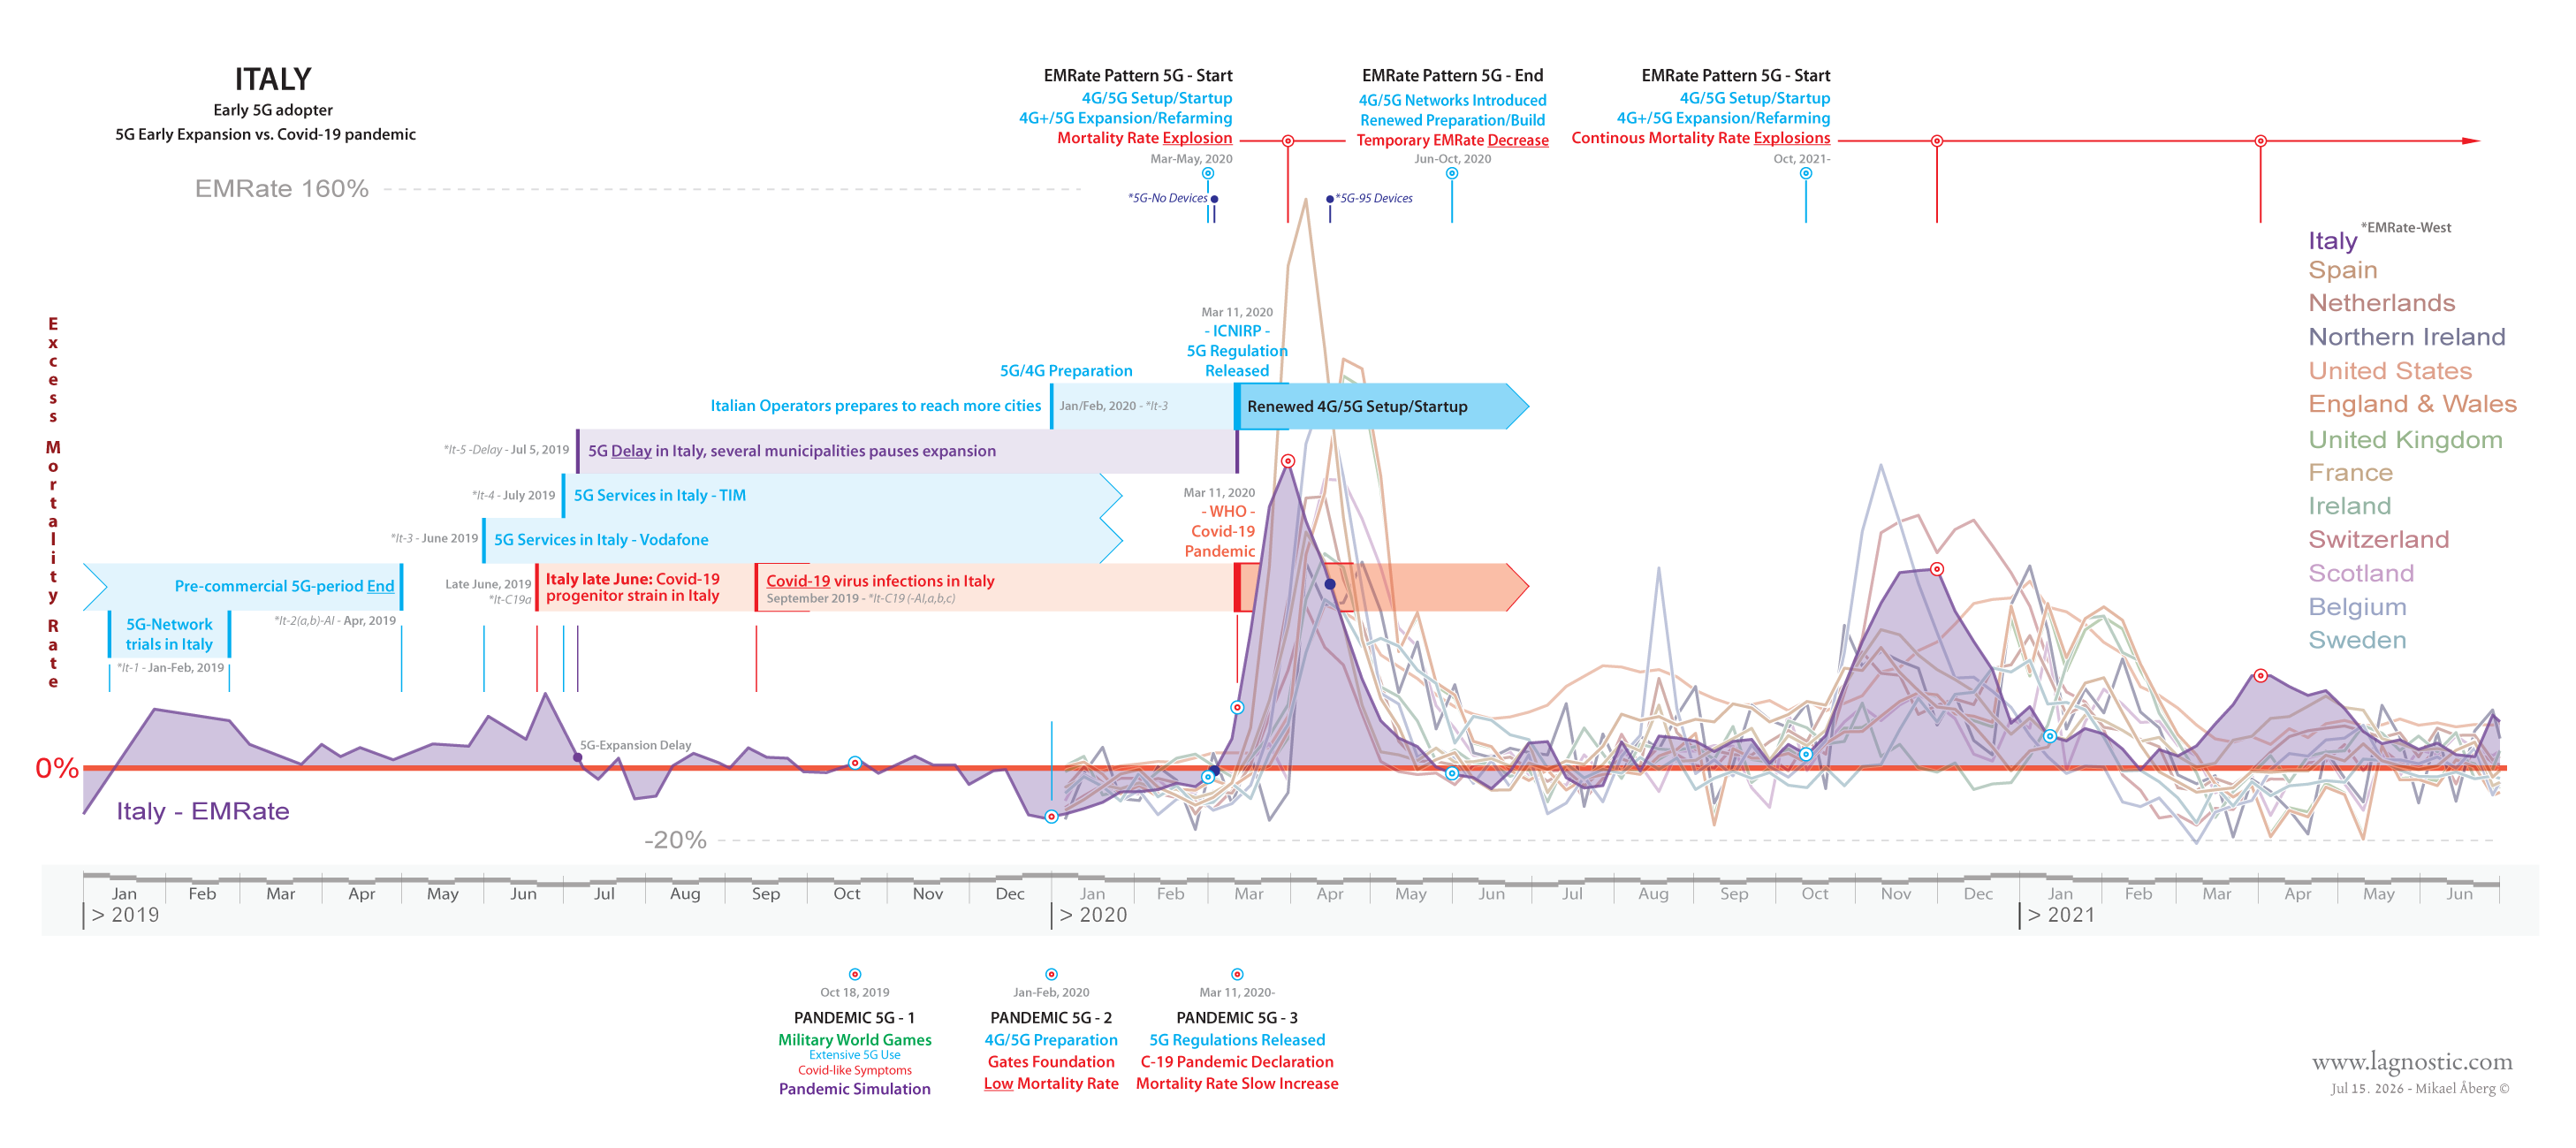
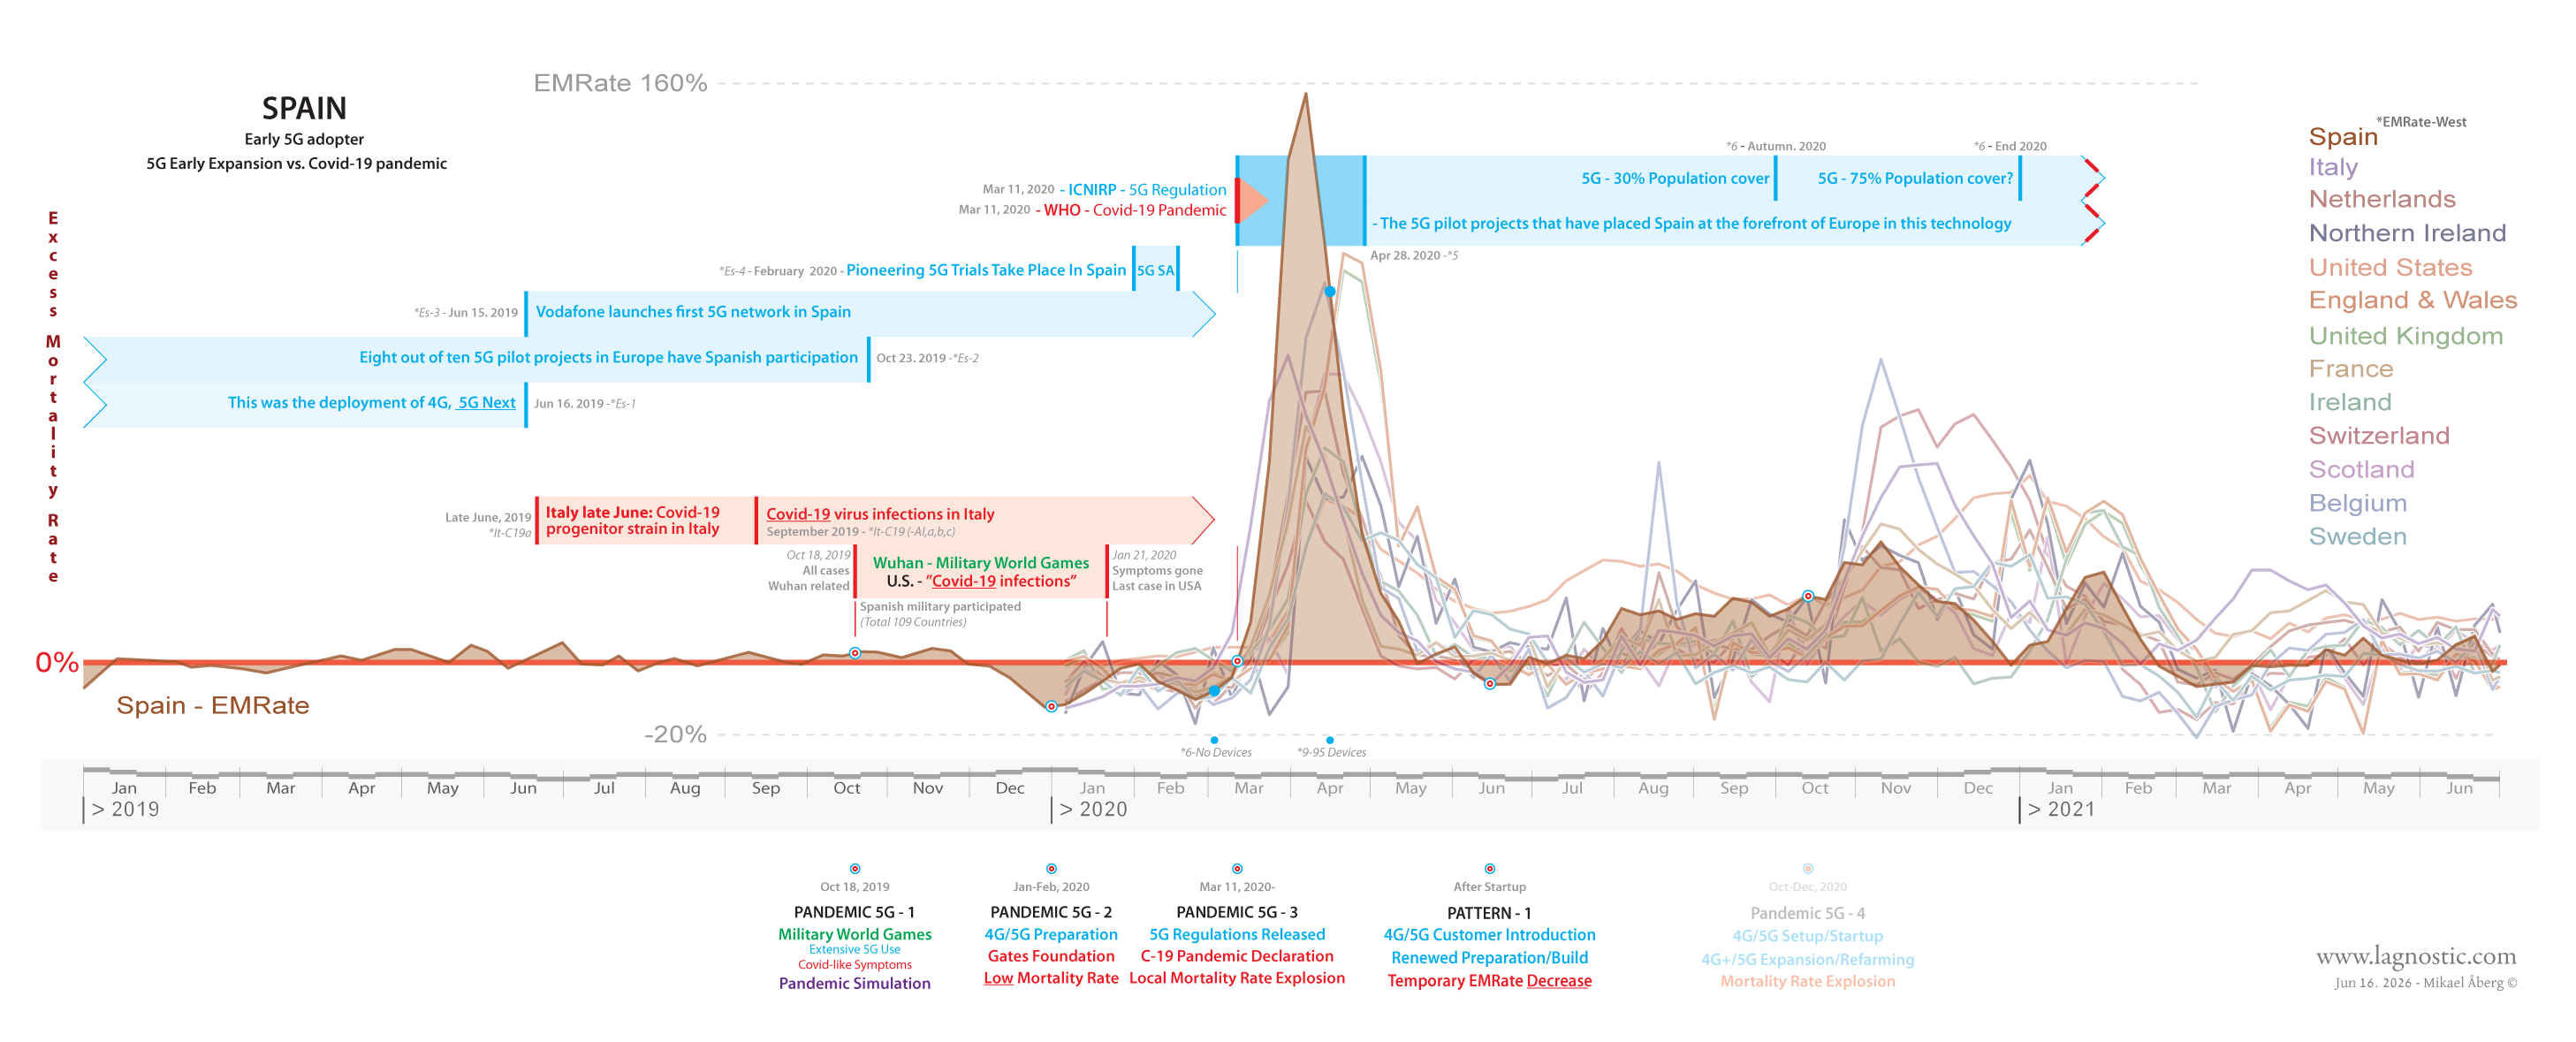
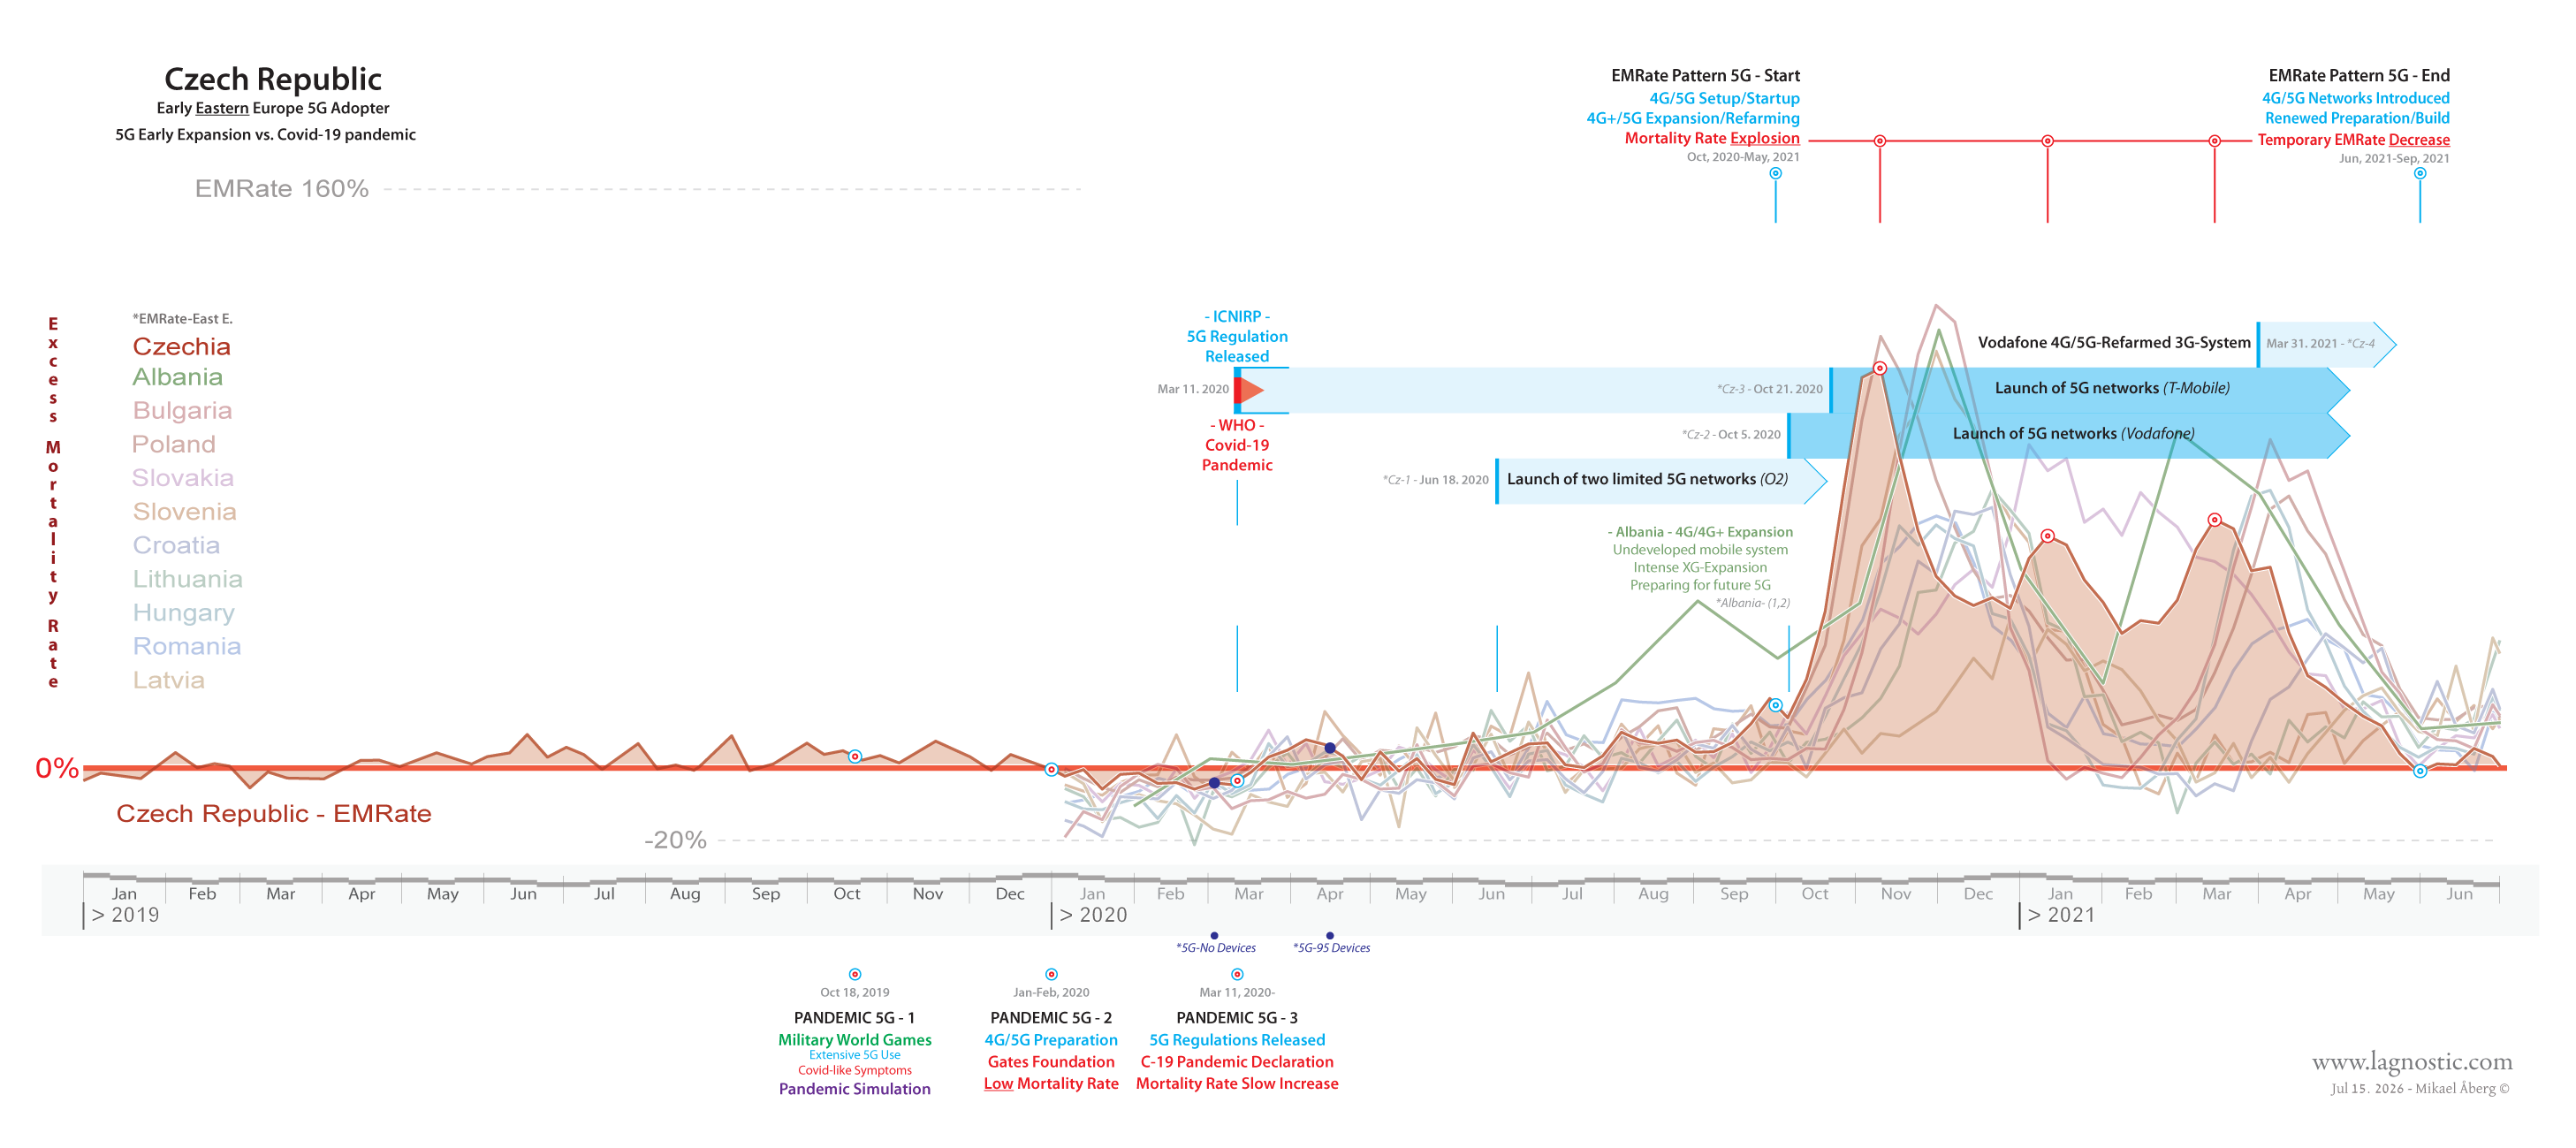
Time-aligned “correlation pattern” integrated into the “excess mortality curve” of 3 countries—Early 5G adopters [continent].
Italy - Southern Europe |
Spain - Southern Europe |
Czech Republic - Eastern Europe |
 |
 |
 |
ITALY First Half of 2019, High Mortality Rates: Coincided with early 5G experiments (aggressive push). Oct. 2020–Jan. 2021 – Mortality Surge: Very high mortality rates correlated with the “rollout” and “setup” of the aforementioned “5G/4G infrastructure” ahead of the “presentation/introduction” of the 5G/4G network to new end customers/users (individuals, businesses), as well as 4G rollouts ahead of upcoming 3G refarming (exchange programs, frequency bands, increased bandwidth).
Note 2. Nearly identical correlations exist in a very large number of countries around the world, though timing and EMRate vary depending on technical maturity [mobile infrastructure], deployment speed, population density, geography, and the radio frequency bands [RF-MW bands] in use. |
||
_ 3:3_
Early—COVID-19, 5G Development, and Mortality—General Correlation Patterns
Early 5G/EMrate symbiosis and very common 5G/4G+ startup effects of EMrate patterns.
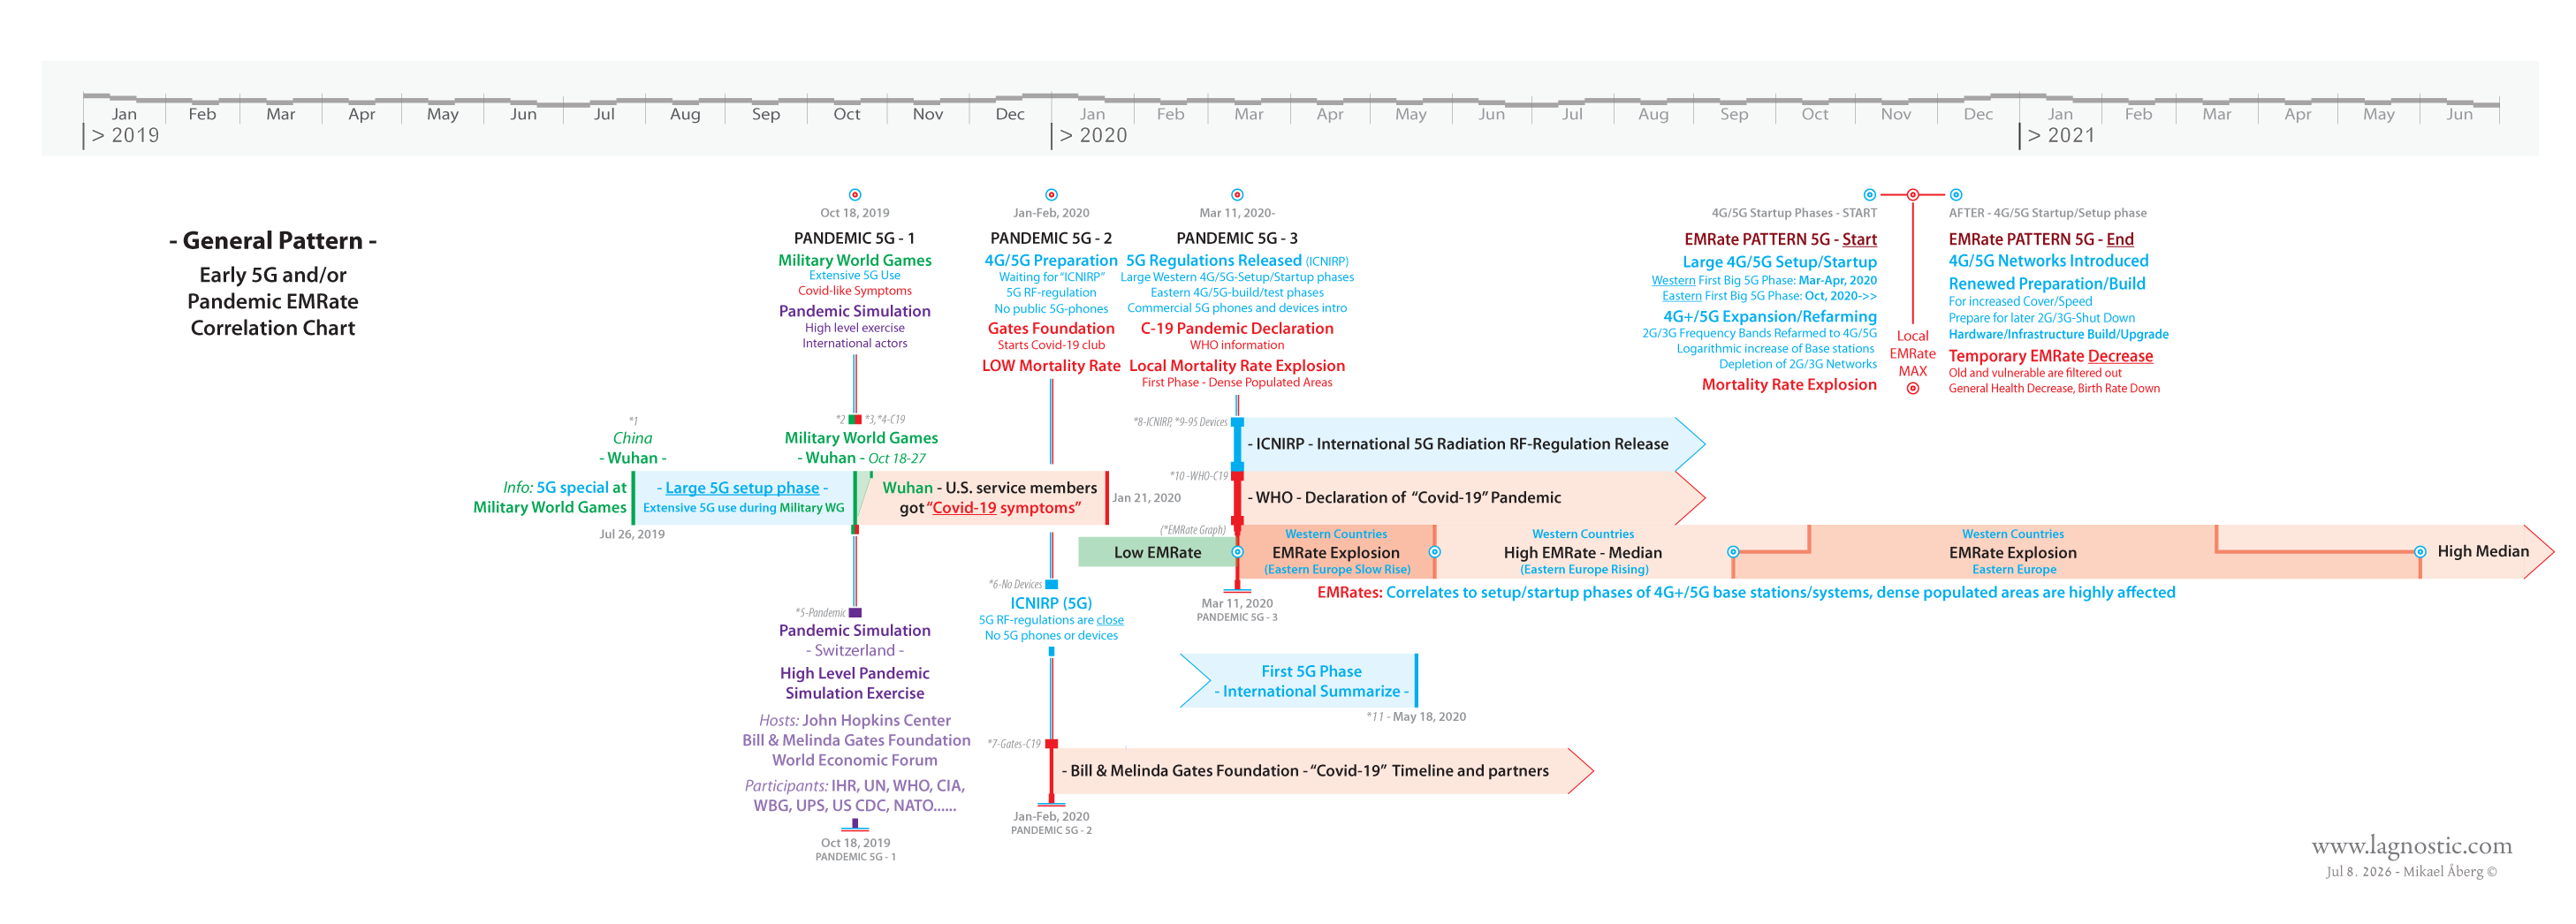
Correlation Patterns in Parts: 4 Links - (New window)
Pandemic 5G - 1 -- Pandemic 5G - 2 -- Pandemic 5G - 3 -- EMRate Pattern 5G